In modern DWDM systems, OSNR (Optical Signal-to-Noise Ratio) is one of the most trusted indicators of optical signal health. It compares optical signal power to optical noise power, so it helps engineers judge whether a wavelength can deliver stable service. Because DWDM links often rely on optical amplification, this metric becomes even more important across long spans and high channel counts.
What OSNR Means in Practical Terms
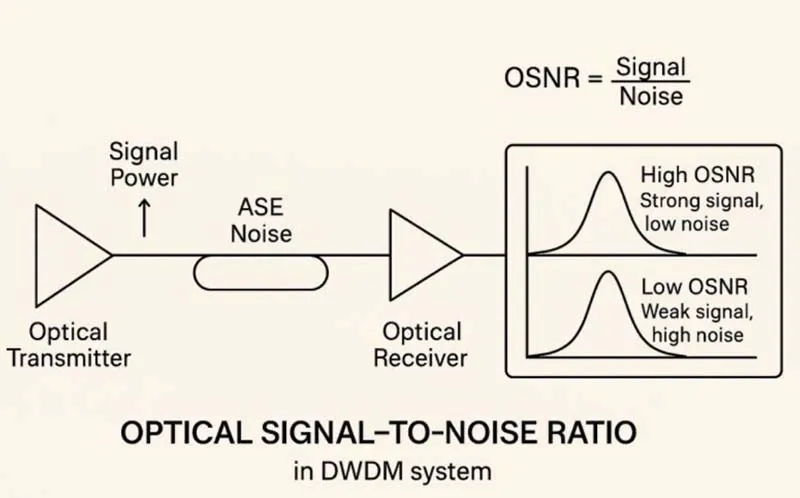
It describes how “clean” a wavelength looks after it travels through fiber and passes optical amplifiers. When the ratio stays high, the receiver sees a stronger signal relative to noise. As a result, the bit error rate tends to stay low and the service remains stable. Conversely, when OSNR falls, errors rise and performance degrades.
A Simple Definition
Engineers often describe it with a straightforward relationship:
- OSNR = Signal Power / Noise Power
Although the idea is simple, OSNR reflects many link realities, including attenuation, amplification strategy, and accumulated noise.
Where OSNR Is Measured in DWDM Systems
In DWDM networks, teams typically measure OSNR per channel. They often check it after optical amplification and near the receiver side of the link. In addition, measurements commonly use a reference bandwidth of 0.1 nm (12.5 GHz), which supports consistent comparison across channels and sites.
Why the Measurement Point Matters
After an EDFA, the signal power rises, but noise rises too. Therefore, OSNR measured after amplification captures what the receiver must handle. If you measure at the wrong point, you may overestimate link health.
Why it Matters for Capacity and Reliability
It directly influences whether a wavelength meets performance targets. Moreover, it impacts design decisions like span length, amplifier placement, and channel loading.
High OSNR vs Low OSNR
- High OSNR usually means a cleaner signal and fewer errors.
- Low OSNR often leads to higher BER and service degradation.
As bandwidth demand grows, operators push higher-order modulation and tighter margins. Consequently, OSNR becomes a key gate for upgrades and turn-up acceptance.
Typical OSNR Requirements for Coherent Systems
Different coherent rates demand different margins. For example, common engineering references include:
- 100G coherent: OSNR > 15 dB
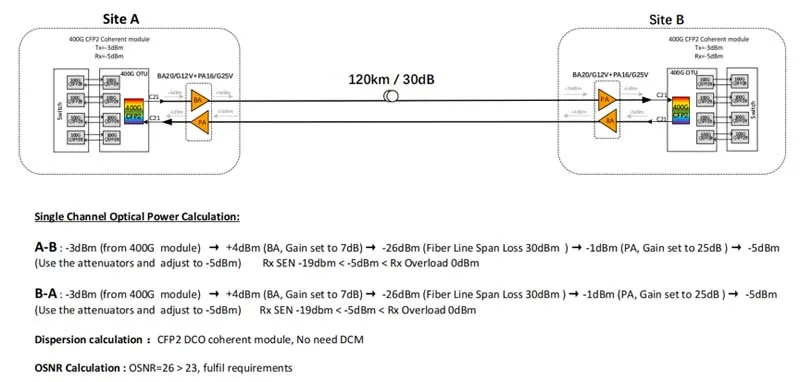
- 400G coherent: OSNR > 23 dB
However, real thresholds can vary by vendor, modulation format, FEC strength, and channel plan. Even so, these values provide a practical starting point for DWDM planning.
What Reduces OSNR in the Real World
It does not drop for a single reason. Instead, it declines as multiple impairments accumulate across the optical path.
1) Amplifier Noise (ASE)
Optical amplifiers such as EDFAs and Raman stages introduce ASE noise. Therefore, every amplification stage can reduce OSNR if the design does not manage noise carefully.
2) Fiber Attenuation and Span Design
Loss in the fiber forces higher gain later. As a result, the link may accumulate more noise across repeated amplification. In addition, very long spans can shrink your operating margin quickly.
3) Nonlinear Effects and System Loading
When channels run hot and dense, nonlinearities can worsen signal quality. Moreover, aggressive launch power can trade higher signal power for higher nonlinear penalty, which does not always improve it outcomes in practice.
How to Improve OSNR in DWDM Links
When it runs low, teams can respond with both optical and system-level actions. Importantly, the best fix depends on the dominant impairment.
Use Low-Noise Amplification
Choose amplification stages with strong noise performance. Also, tune gain and power targets carefully to avoid unnecessary noise buildup.
Shorten Spans or Add Better Placement
If spans are too long, consider shortening the distance between amplifiers. Alternatively, optimize amplifier placement to reduce extreme gain requirements. As a result, the noise accumulation slows.
Manage Dispersion and Nonlinear Penalties
Dispersion management can help reduce nonlinear sensitivity in some designs. In addition, launch power optimization often improves real end-to-end performance, even if the headline power looks lower.
Leverage Coherent Detection and DSP
Coherent receivers use DSP to tolerate impairments better than legacy methods. Therefore, modern coherent systems can often operate at lower OSNR than older technologies, depending on their FEC and modulation choices.
Symptoms of Poor OSNR You Can Spot in Operations
When it falls below the operating threshold, issues often appear quickly. For example, teams may observe:
- Bit errors increasing
- CRC or alarm errors
- DWDM channel flapping
- Increased BER even under FEC
If you see these symptoms, check it alongside power levels, spectrum loading, and amplifier status. Then, correlate changes with maintenance events or configuration updates.
A Practical OSNR Checklist for Turn-Up and Troubleshooting
To keep it under control, use a consistent process:
- Measure per-channel OSNR using the same bandwidth reference.
- Compare against the target for the specific service rate and platform.
- Review amplifier chain settings and recent changes.
- Verify span loss assumptions and fiber health.
- Rebalance channel powers if loading changed.
- Re-test after adjustments and document the outcome.
With this approach, It becomes a daily operational tool, not just a lab metric.

It remains a cornerstone metric for DWDM engineering because it links physical-layer reality to service stability. Moreover, it helps teams plan upgrades, validate turn-ups, and troubleshoot outages with confidence. When you design for OSNR and monitor it consistently, you protect capacity today and create cleaner headroom for tomorrow’s faster coherent wavelengths.